What is conversion rate optimization (CRO)? A practical guide
Learn what conversion rate optimization (CRO) is, the steps of the CRO process, how to prioritize ideas and how to measure the results in revenue.
11 min readUpdated
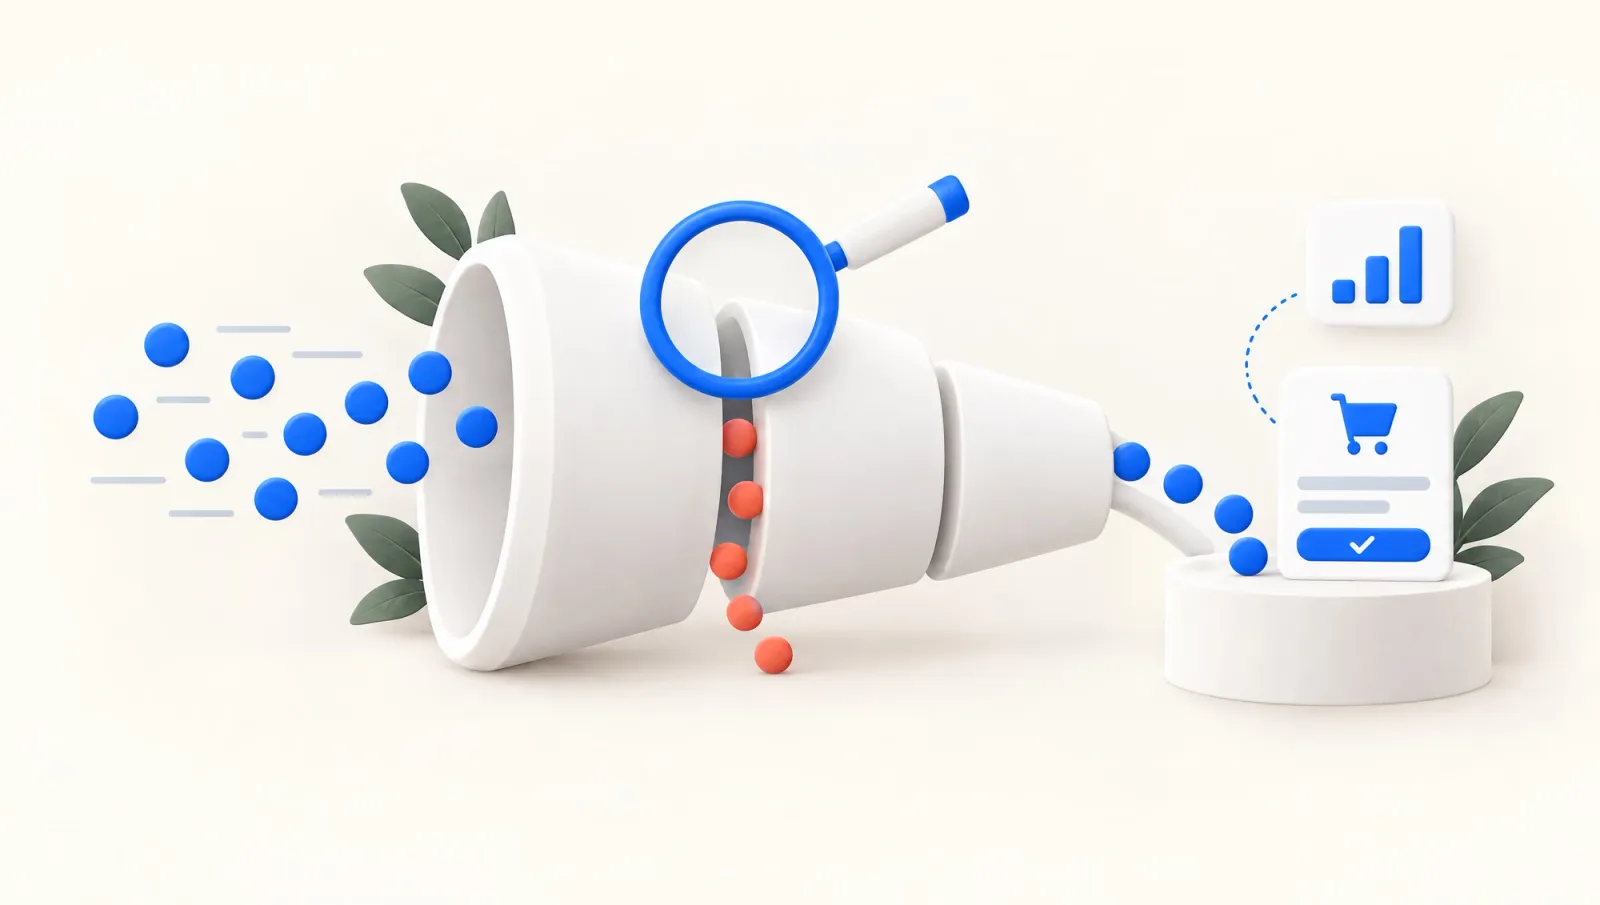
Conversion rate optimization (CRO) is the practice of improving pages, flows and offers. The aim is for a larger share of the visitors you already have to take the action you want. That action might be a purchase, a form submission, a demo request or a sign-up. CRO starts with evidence, not ideas: you find where visitors get stuck, pick the most valuable problem, fix it and measure the result.
This guide walks through the CRO process, how to choose where to start, how to prioritize ideas and how to measure the work in revenue. It also covers what changes for service, business-to-business (B2B) and lead generation sites, which most CRO guides treat as an afterthought. Sources were checked on November 1, 2026.
What is conversion rate optimization (CRO)?
Conversion rate optimization is the work of getting more results from existing traffic. Paid media and SEO grow the number of visitors. CRO removes the friction those visitors meet once they arrive. The two support each other: when the same ad spend produces more orders or qualified leads, every new visitor is worth more.
What counts as a conversion depends on the business. For an online store it is a purchase. For a software company it may be a demo request, for a consultancy a quote form, for an app an account sign-up.
Steps on the way, such as adding to cart, joining an email list or viewing the pricing page, are micro conversions. They show where a funnel leaks, but they do not replace the goal that pays the bills.
Conversion rate and its denominator
A conversion rate is the number of conversions divided by the audience that could have converted. If you need to calculate conversion rate quickly, the conversion rate calculator does the arithmetic and explains the inputs. For CRO the denominator matters more than the formula.
Google Analytics 4 now calls conversions "key events". Its session key event rate divides the sessions that included a key event by all sessions. Its user key event rate divides the users who completed one by all users.
Google Ads divides conversions by ad interactions rather than visitors. Three different rates for the same month are normal, so state which denominator a report uses and compare like with like.
A hypothetical example shows what the denominator does. Say a site gets 40,000 sessions and 25,000 users in a month. The key event happens in 400 sessions, and those sessions come from 360 different users:
Rate type: Session-based
- Numerator
- 400 converting sessions
- Denominator
- 40,000 sessions
- Conversion rate
- 1.0%
Rate type: User-based
- Numerator
- 360 converting users
- Denominator
- 25,000 users
- Conversion rate
- 1.44%
| Rate type | Numerator | Denominator | Conversion rate |
|---|---|---|---|
| Session-based | 400 converting sessions | 40,000 sessions | 1.0% |
| User-based | 360 converting users | 25,000 users | 1.44% |
The same month, the same site and the same conversions give two different rates. Suppose a report switches from the session-based rate to the user-based one. It then shows a rise from 1.0% to 1.44%, even though nothing on the site changed except the denominator.
Benchmarks for a good conversion rate are often quoted without a source. One that does show its sample is Unbounce's 2024 report. It puts the median landing page conversion rate across all industries at 6.6%, based on more than 41,000 landing pages built with Unbounce.
That figure describes those landing pages, not a store's sitewide traffic. The most reliable comparison for your own rate is the history of the same funnel step, the same channel and the same definition.
What are the steps of the CRO process?
The CRO process runs as a loop: research, prioritize, test or ship, then feed what you learned into the next round. Teams name the stages differently, but the order is usually this:
- Set the goal and the primary metric: Write down the business goal, the conversion that reflects it and its denominator. For a lead site that may be "qualified lead" rather than "form submission".
- Map the funnel: Use analytics to find the step where most visitors leave. The step with the largest drop is usually the first place to look.
- Research the cause: Numbers show where a problem is, not why it happens. Heatmaps, session recordings, short surveys and usability tests explain what stops people.
- Write a hypothesis: Turn each problem into "if we change this, because of that, this metric will improve".
- Prioritize: Rank ideas by expected impact, supporting evidence and effort.
- Test or ship, then measure: With enough traffic, run the change as an A/B test. Fix an obvious bug without waiting for a test and compare before and after with care. Record the result together with what you learned.
A/B testing is one step in that loop. How to set up a test, write the hypothesis and read the result is covered in the complete A/B testing guide.
Research methods and what they tell you
No single data source is enough, and most CRO tools fall into one of the groups below. The table compares the methods most CRO programs rely on, by the question each one answers and the one it cannot.
Method: Funnel analysis
- What it shows
- Which step visitors leave at
- What it cannot show
- Why they leave
- Example tool
- GA4 funnel exploration
Method: Heatmaps and recordings
- What it shows
- Clicks, scrolling and moments of hesitation
- What it cannot show
- What the visitor was thinking
- Example tool
- Microsoft Clarity
Method: On-site surveys
- What it shows
- The obstacle in the visitor's own words
- What it cannot show
- How the silent majority behaves
- Example tool
- Survey and form tools
Method: Usability testing
- What it shows
- Problems people hit while doing a task
- What it cannot show
- How common each problem is
- Example tool
- Moderated sessions
Method: A/B testing
- What it shows
- A change's effect on a metric
- What it cannot show
- Why the effect happened
- Example tool
- Testing platforms
| Method | What it shows | What it cannot show | Example tool |
|---|---|---|---|
| Funnel analysis | Which step visitors leave at | Why they leave | GA4 funnel exploration |
| Heatmaps and recordings | Clicks, scrolling and moments of hesitation | What the visitor was thinking | Microsoft Clarity |
| On-site surveys | The obstacle in the visitor's own words | How the silent majority behaves | Survey and form tools |
| Usability testing | Problems people hit while doing a task | How common each problem is | Moderated sessions |
| A/B testing | A change's effect on a metric | Why the effect happened | Testing platforms |
Read the table in two halves. Quantitative methods answer where and how much, qualitative ones answer why. GA4's funnel exploration visualizes the steps users take and how well they succeed or fail at each one. Microsoft Clarity offers heatmaps and session recordings for free with no traffic limit.
For usability testing, Nielsen Norman Group has a well-known finding on testing with five users. Five users uncover about 85% of the problems in a design. The same article notes that this holds for users who are alike. It adds that distinct user groups need three or four people each, and that quantitative studies need about 20.
If you are still choosing a platform for the testing step, the comparison of the best A/B testing tools sorts them by use case.
How do you prioritize CRO ideas?
You prioritize CRO ideas by scoring every idea on the same criteria, starting with pages that combine high traffic, a large drop-off and valuable conversions. Those three tend to meet on checkout steps, product or service pages, pricing pages and forms. A big problem on a page few people see is usually worth less than a medium one on a page everyone sees.
Mapping the funnel step by step makes this choice clearer, and the funnel analysis calculator shows the conversion and drop-off at each step. For online stores, checkout almost always makes the list.
Baymard Institute's average of 50 cart abandonment studies puts the documented cart abandonment rate at 70.22%. Baymard also estimates that large ecommerce sites could see a 35.26% increase in conversion rate from checkout design improvements alone. That estimate counts only the issues its research treats as solvable.
Its research finds that an ideal checkout can be completed with 7 to 8 form fields, while the average US checkout asks for about 15. Every unnecessary field is an early candidate.
The strongest CRO strategies come out of this research, and once it is done most teams have more ideas than they can ship. Prioritization frameworks rank them on shared criteria, and the table compares the three best known.
Framework: PIE
- Criteria
- Potential, importance, ease
- Strength
- Fast ranking at page level
- Watch out for
- Scores vary between people
Framework: ICE
- Criteria
- Impact, confidence, ease
- Strength
- Simple, works for any idea
- Watch out for
- Confidence can drift into gut feel
Framework: PXL
- Criteria
- Yes/no questions plus effort
- Strength
- Builds evidence into the score
- Watch out for
- Takes longer to set up
| Framework | Criteria | Strength | Watch out for |
|---|---|---|---|
| PIE | Potential, importance, ease | Fast ranking at page level | Scores vary between people |
| ICE | Impact, confidence, ease | Simple, works for any idea | Confidence can drift into gut feel |
| PXL | Yes/no questions plus effort | Builds evidence into the score | Takes longer to set up |
Chris Goward developed PIE (potential, importance, ease), mainly to decide which pages to test first. ICE (impact, confidence, ease) is a three-part score popularized by Sean Ellis, founder of GrowthHackers.
CXL's PXL framework replaces subjective scores with concrete questions. They ask whether the change is above the fold, whether it is noticeable within five seconds and whether it adds or removes an element. They also ask whether it runs on a high-traffic page and whether it is supported by user testing, qualitative feedback, heatmaps or analytics. Whichever you choose, applying one scale to every idea and noting the evidence behind each score matters more than the framework's name.
How do you measure CRO in revenue, not just conversion rate?
You measure CRO in revenue by pairing the conversion rate with a value metric. A conversion rate on its own can mislead. A variant that pushes a discount code may win more orders and still bring in less money.
In ecommerce, track revenue per visitor (total revenue divided by visitors) and average order value next to the conversion rate. As a hypothetical example, suppose the conversion rate rises from 2.0% to 2.2% while average order value falls. Revenue per visitor may not have moved at all, and that second metric is the safer basis for a decision.
CRO for service, B2B and lead generation sites
On service, B2B and lead generation sites, CRO should grow the qualified business that forms produce. Most CRO guides are written for online stores, so this gets skipped. Shortening a form can raise submissions and lower the number of leads sales is willing to work. The primary metric should be leads that sales accepts as qualified, or closed deals.
That requires connecting your customer relationship management (CRM) system to your measurement. Google Ads lets you send CRM outcomes back as conversions, such as a lead becoming qualified or a deal closing offline. Page changes and campaigns can then be judged on business results rather than form fills.
On lead pages, the usual places to look start with each form field: what it asks for and why. Another is whether the page answers visitors' questions about price and process. Two more are whether proof such as references and case studies is visible at the moment of decision and how fast the first follow-up happens. That last one sits outside the page but is part of the conversion.
What is the difference between CRO and SEO?
SEO brings the right people to a page from search, and CRO helps the people on that page act. Done properly, they do not conflict.
Google's search documentation supports website testing and sets four rules. Do not show search engines different content than users (cloaking), and use rel="canonical" pointing to the original when variants live on separate URLs. Use a temporary 302 redirect rather than a permanent 301 when a redirect is needed, and run a test only as long as necessary. The details are in Google's guidance on website testing and search.
Real conflicts come from content decisions. Cutting copy to lift conversions can remove the information a searcher came for. Keep what serves both the reader and the purchase, and change its order and visibility before deleting it.
Time and traffic
How long does CRO take to show results?
How long CRO takes depends on traffic and on the kind of change. Fixing an obvious bug, such as a broken button on mobile, can show results within days.
An A/B test needs to reach its required sample, and the sample size calculator tells you how many visitors that is. Testing platforms' own guidance recommends running a test for at least one to two weeks so it covers weekday and weekend behavior. A CRO program takes longer than a single test to pay off consistently, because many tested ideas do not move the metric.
Can you do CRO with low traffic?
Yes, you can do CRO with low traffic, but the method shifts. Detecting small differences with an A/B test can take weeks or months when few people visit. The weight moves to qualitative research instead.
A five-person usability test, session recordings and one short on-page question can surface a page's biggest obstacles. Clear usability problems can be fixed without a test.
If you do test, try bolder changes rather than cosmetic ones, such as the offer, the page structure or the form flow. The larger the effect, the smaller the sample needed to detect it. Micro conversions work as early signals, but base the final decision on the goal that matters.
CRO works best as a repeating cycle of research, prioritization, testing and learning rather than a one-off project. For test ideas organized by page type and goal, browse the A/B test library.

Related tools
- Conversion Rate (CR) CalculatorCalculates the share of users who complete a target action.
- Funnel Analysis CalculatorShows conversion and drop-off across multiple funnel steps.
- A/B Test LibraryA structured experiment library. Each scenario keeps the hypothesis, the one variable that changes, the decision metric, guardrails and setup risks together.
What to read next
 November 14, 2026Funnel optimization: how to diagnose each step and test the fixFunnel optimization starts with lost users counted per step and weighed by later steps. Segment the funnel, then test one change against a control group.
 November 14, 2026How to increase form conversions: measure each field, fix, then testTo increase form conversions, measure which field people leave at with GA4 events, fix the problem in that field and test the change against a control group.
 November 14, 2026How to run a CRO audit: tracking, then the drop-off and its causeA CRO audit runs in order: match GA4 purchases to your orders, find the drop-off in step data, look for its cause, then turn findings into ranked tests.