What is a customer journey? Stages, map and examples
A customer journey is what a customer goes through to reach a goal. How to choose its stages, map it and check the map against data, with an example.
17 min read
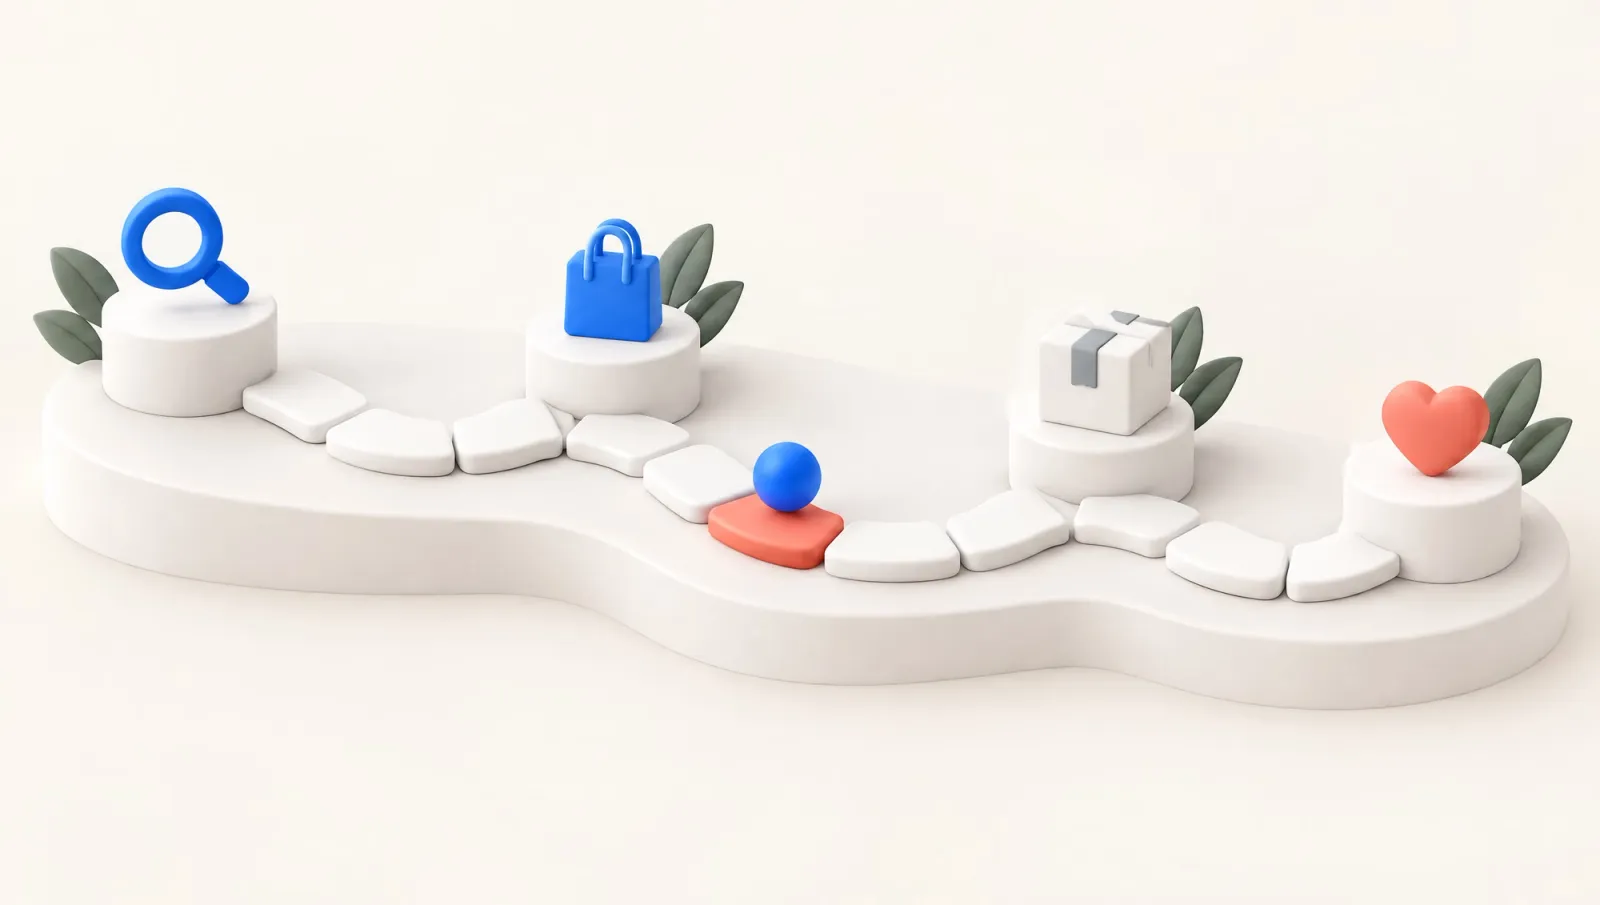
What is a customer journey? It is the series of steps a person goes through with a business to reach a goal. The steps run from noticing a need to buying, using the product and coming back.
A customer journey map lays one of those journeys out over time and shows what the customer does, thinks and feels at each step. A map is useful when it shows, with evidence, where customers get stuck.
Stage names and counts differ from one source to the next. So pick stages from what the customer is trying to do at that point and from a signal in your data.
A problem on the map may need an automated flow in a customer relationship management (CRM) tool, or a screen or process change. The triggers, waits and exit conditions of automated flows live in the site's journey library.
A customer journey, a journey map and a CRM journey are different things
The customer journey is the experience itself, and it happens whether or not you record it. A journey map is a research output that documents one slice of it. Nielsen Norman Group (NN/g) defines the map in Journey Mapping 101 as a visualization of the process a person goes through to accomplish a goal. The same article says "user journey map" and "customer journey map" can be used interchangeably.
NN/g lists the service blueprint among the concepts people confuse with journey maps. A blueprint takes the business's viewpoint instead of the customer's and shows which people and processes work behind each touchpoint. Take an order-tracking problem. The map shows what the customer goes through, and the blueprint shows what the carrier integration and support team do meanwhile.
The journey in a CRM tool is a third thing. It is an automated message flow that starts on an event, waits, branches and ends on a condition. As of November 2026, Braze's Canvas documentation describes Canvas as a visual journey builder that connects steps into a user flow.
Mailchimp's help page on automation flows starts each flow with a trigger and ends it with an exit condition. It calls the drawing an "automation flow map". So when a CRM team says "map", it may mean a research document or an automation diagram.
The CRM and marketing automation tools comparison lists what each platform calls its journey builder. A sales funnel gets mixed in too. The funnel counts how many people move between stages, and the map tries to explain why the others got stuck.
What goes into a customer journey map
The look of a customer journey map changes from one business to the next, but the contents stay much the same. NN/g counts five elements common to every map. Its guide on when and how to create journey maps adds touchpoints, channels and ownership.
- Actor: whose point of view the map takes. NN/g recommends one point of view per map. Two customer types need two separate maps.
- Scenario and expectations: the actor's goal and what they expect along the way, such as getting an order on time and without trouble.
- Stages: the high-level phases of the journey. Everything else on the map sits in these columns.
- Actions, thoughts and emotions: what the customer does, wonders about and feels in each stage. Thoughts are ideally the customer's own words from research.
- Touchpoints and channels: the moments the customer meets the business and where, such as the website, the app, email, a store or a call center.
- Opportunities, ownership and metrics: improvement ideas, the team that owns each one and how the improvement will be measured.
The last item is what makes the map useful. NN/g writes that insights and ownership are often overlooked, and that without ownership no one can change anything. If the emotion line is done but nobody knows who fixes a problem or how a fix will be measured, the map stays a presentation.
Customer journey stages depend on the model
There is no single list of customer journey stages that everyone accepts. Stage lists in guides differ in both length and names. NN/g writes that stages vary from scenario to scenario and that each organization usually has data to decide them. The table puts frequently cited models side by side.
Model: Kotler's 5A path
- Stages
- Aware, appeal, ask, act, advocate
- What it emphasizes
- Covers recommending after purchase
Model: McKinsey consumer decision journey
- Stages
- Initial consideration, active evaluation, closure, postpurchase
- What it emphasizes
- The decision repeats as a loop
Model: Google's messy middle model
- Stages
- Trigger, exploration and evaluation loop, purchase
- What it emphasizes
- The middle is not linear
Model: NN/g ecommerce example
- Stages
- Discover, try, buy, use, seek support
- What it emphasizes
- Stages follow the scenario
Model: NN/g internal tool example
- Stages
- Purchase, adoption, retention, expansion, advocacy
- What it emphasizes
- The journey can start at purchase
| Model | Stages | What it emphasizes |
|---|---|---|
| Kotler's 5A path | Aware, appeal, ask, act, advocate | Covers recommending after purchase |
| McKinsey consumer decision journey | Initial consideration, active evaluation, closure, postpurchase | The decision repeats as a loop |
| Google's messy middle model | Trigger, exploration and evaluation loop, purchase | The middle is not linear |
| NN/g ecommerce example | Discover, try, buy, use, seek support | Stages follow the scenario |
| NN/g internal tool example | Purchase, adoption, retention, expansion, advocacy | The journey can start at purchase |
The AMA's article on Marketing 4.0 gives Kotler's path as aware, appeal, ask, act and advocate. It sums up ask as being convinced and act as buying. A Quarterly Review of Business Disciplines article quotes the book with page numbers. In the book's own description of ask, customers actively research for more information from friends and family, the media or the brands.
The AMA also reports that Kotler wanted readers to recognize the alternative paths to purchase that customers take. McKinsey's consumer decision journey article rests on the purchase decisions of almost 20,000 consumers across five industries and three continents. Google's consumer insights team describes, in its messy middle research, a loop of exploration and evaluation between trigger and purchase.
The models are not rivals, since they answer different questions. McKinsey and Google focus on the purchase decision, while NN/g gives examples for mapping any goal. Instead of copying one list, choose your own stages with two rules.
Name each stage after the customer's goal
A stage name should say what the customer is trying to do at that point. Write "find a product that fits" rather than "consideration", and "use the product regularly" rather than "retention". Names taken from business goals (acquisition, conversion, retention) turn the map back into an inside-out document. Also write an entry signal and an exit signal for each stage: which event puts a customer into it and which takes them out.
The signal is what lets you compare the map with data. A "try the product" stage might start with the delivery record and end with a first-use event or a return request. If a stage has no counterpart in your data, its content comes only from interviews, and the map should say so.
The journey does not run in a straight line
Customers do not pass through the stages once and in order. McKinsey writes that the postpurchase experience shapes every later decision in the category, so the journey is an ongoing cycle. Google's research says people loop through exploration and evaluation as many times as they need before deciding to buy.
A funnel report does not show this loop on its own. In GA4 funnel exploration, an open funnel lets users enter at any step, and a closed funnel makes them enter at the first. Either way, the help page says users are counted only in the steps they complete in the specified sequence. If a user completes the steps more than once, only the first sequence is reported.
The open or closed choice decides how users can enter the funnel, so it settles whether customers who enter mid-journey are counted. Returns and repeats need a separate analysis. Google's path exploration help page says the report can uncover looping behavior that may indicate users becoming stuck.
How to make a customer journey map
A good map starts as a workshop draft and becomes a decision tool once customers have tested it. NN/g's five-step mapping process begins with a team and a scope, then moves through internal research, an assumption map, customer research and visualization. The order below combines that process with the data a CRM team already has.
- Write the goal and the scope. In one sentence, write which business goal the map supports, whose journey it shows and which scenario it covers. NN/g recommends always tying a map to a known business goal.
- Gather what you have. Survey results, support and call-center logs, on-site feedback and return reasons usually sit with different teams. Short interviews with sales, support and product teams bring the pieces together.
- Draw the assumption map. Draft the map as a team and note what each box rests on: a customer quote, a record or a team assumption. The draft is a hypothesis until customers have tested it.
- Test it with customers. Fill the gaps with interviews, observation or diary studies. NN/g writes that 6–8 participants are enough to get started when budget or time is limited.
- Check it against data. Count each stage's entry and exit signals in your event or order data, and see how many customers show the problems you heard about.
- Visualize it and assign owners. Finish the map, give each pain point an owner and a metric, and put the map's date and its data period at the top.
Step five is not part of NN/g's process and is meant for teams that have CRM data. NN/g says quantitative data can support or validate the story but cannot build it alone. Numbers do not replace interviews. They show how often the signal chosen to stand for a problem appears.
Checking the map against data
Maps and behavioral data correct each other. Interviews describe the problem in the customer's own words, while records show how often the signal chosen to represent it appears. A ticket count is not the number of customers who struggled to track an order, since some wait or give up without a ticket. A stage with no signal, such as first use after delivery that is never recorded, points to a tracking gap worth fixing.
Counting moves between stages is a funnel calculation. To enter the count at each stage and see the drop at every step, use the funnel analysis calculator. Which signals your current events can capture is a separate job. The site's Journey Builder reads your events and shows which journey patterns your data can support.
Some touchpoints never reach your data. In McKinsey's 2009 research, two-thirds of the touchpoints in the active-evaluation phase were consumer-driven. Examples include internet reviews and word of mouth from friends and family. These touchpoints rarely appear in CRM data, so interviews and surveys are where you learn about them.
Where AI fits in this chain is a separate topic, for example a churn score used as a stage signal. The post on AI in lifecycle marketing separates prediction, decisions and content generation.
Hypothetical example: from first order to second order
A hypothetical ecommerce store maps the journey of 1,000 customers who placed a first order in the same month. The actor is a first-time buyer, and the scenario runs from the first order to the next need. Each customer is followed for 90 days after their own first order.
The outcome is the number of customers who place a second order within those 90 days that is not cancelled or returned. Support tickets and return requests count only if they belong to the first order and come before any second order. A later ticket cannot explain an earlier decision. The comparison is made once every customer's 90 days have ended and the return period for second orders has passed.
Interviews surfaced two problems: customers who could not tell where their order was, and customers who returned what they bought. The table names each stage after the customer's goal and counts the customers who carry the signal measured at that stage. To keep the arithmetic plain, no customer falls into both problem groups.
Stage (customer's goal): Place a first order
- Touchpoint
- Checkout page
- Signal measured
- First order (start of the cohort)
- Customers with the signal
- 1,000
Stage (customer's goal): Track the order
- Touchpoint
- Shipping notice, tracking page
- Signal measured
- Support ticket before delivery
- Customers with the signal
- 150
Stage (customer's goal): Try the product
- Touchpoint
- Package, usage info
- Signal measured
- Return request
- Customers with the signal
- 50
Stage (customer's goal): Need it again
- Touchpoint
- Email, website
- Signal measured
- Second order within 90 days
- Customers with the signal
- 177
| Stage (customer's goal) | Touchpoint | Signal measured | Customers with the signal |
|---|---|---|---|
| Place a first order | Checkout page | First order (start of the cohort) | 1,000 |
| Track the order | Shipping notice, tracking page | Support ticket before delivery | 150 |
| Try the product | Package, usage info | Return request | 50 |
| Need it again | Email, website | Second order within 90 days | 177 |
The rows are not a funnel. The first row is the starting cohort, the middle two are problem signals and the last counts customers who placed a second order. A customer who never opened a ticket may still have tracked the order.
The second-order rate splits by group. Of those who opened a support ticket before delivery, 10% placed a second order. The share was 4% among those who requested a return and 20% among customers with neither problem.
These rates point to a pain point, not to its cause. Customers who opened tickets may cluster in distant regions or in slower-shipping products, and may come back less for that reason too. To separate the two, compare the groups within the same product category and region.
Hypothetical example: which pain point to look at first
Setting priorities means keeping three amounts apart: the customers the problem affects, the gap visible in current figures and the gain from fixing it. The affected customers are in the table: 150 for support tickets and 50 for return requests.
The visible gap compares a group's actual second-order customers with the number a chosen comparison rate would give. At a comparison rate of 20%, 30 customers in the support-ticket group would have placed a second order, against 15 who did. Those 15 customers are a gap against the chosen rate, not the effect of a fix.
The effect of a fix has not been measured and could be smaller, larger or zero. The comparison rate comes from customers without the problem, and they may differ in other ways too. The ranking therefore depends on that rate. The table keeps both groups' sizes and second-order customers fixed, applies one rate to both and changes only that rate.
Comparison rate: 20%
- Support-ticket group (150 customers, 15 second orders)
- 15
- Return group (50 customers, 2 second orders)
- 8
- Larger gap
- Support ticket
Comparison rate: 16%
- Support-ticket group (150 customers, 15 second orders)
- 9
- Return group (50 customers, 2 second orders)
- 6
- Larger gap
- Support ticket
Comparison rate: 12%
- Support-ticket group (150 customers, 15 second orders)
- 3
- Return group (50 customers, 2 second orders)
- 4
- Larger gap
- Return request
| Comparison rate | Support-ticket group (150 customers, 15 second orders) | Return group (50 customers, 2 second orders) | Larger gap |
|---|---|---|---|
| 20% | 15 | 8 | Support ticket |
| 16% | 9 | 6 | Support ticket |
| 12% | 3 | 4 | Return request |
The two gaps are equal at a comparison rate of 13%, and only when both groups get the same rate. Above it the support-ticket problem stays ahead, and below it the return problem takes the lead. To see which side the true rate is on, compare ticket openers with similar customers in the same products and regions.
The effect of a fix can only be measured by applying it to some customers and keeping the rest as a control group. Fix in advance which event starts the measurement, such as the ticket being opened. Otherwise the two groups may be followed for different lengths of time.
In this example the map shows where the problem is and who owns it, not what the fix should be. If a confirmed delay is behind the tickets, the delivery delay management flow applies, which tells the customer about a delay before they discover it. If the tracking page does not update or the status is unclear, the fix lies in the tracking screen or carrier integration.
Rebuilding the relationship after a return, once the refund is complete, is the subject of refund recovery. Timing the second order belongs to first-to-second purchase. To choose the window for counting a second order, see the ecommerce section of the post on customer retention metrics.
Customer journey examples by business model
When the business model changes, so do the stages and the signals. The customer journey examples below give only the actor, the stages and the cases to keep apart. The first two have their automated flow on a journey page.
Mobile app: from install to first value
In a mobile app, the actor has just installed it, and the scenario runs from first open to the first core benefit. Here the stages could be: open the app, create an account, complete a first task. Coming back the next day belongs to a separate scenario. The app install to first value flow treats a user stuck on sign-up differently from one who never reaches the core action.
Subscription: from free trial to paid plan
For a subscription product with a free trial, the scenario runs from the start of the trial to the first successful payment. The stages could be: start the trial, see the core value, decide to pay, with renewal left to the next period. Keep two cases apart on the map: a trial that ends without any use, and a trial that is used but not paid for. The flow that waits for core value before asking for payment is on the free trial conversion page.
Business-to-business sales
For software sold business-to-business (B2B), most of the map may happen after the contract is signed. In NN/g's example of rolling out an internal tool, the stages are purchase, adoption, retention, expansion and advocacy. Choosing the actor matters here too: the manager who approves the purchase and the employee who uses the tool every day need two separate maps.
What a journey map cannot show
A customer journey map's limits come from how it is made. It is drawn from one actor's point of view, so it does not show what another customer type goes through. Thoughts and the emotion line rest on a handful of interviews. With 6–8 participants you can see that a problem exists, but not how many customers it affects.
A map does not separate cause from effect either. In the hypothetical example, ticket openers coming back less does not show that the ticket made them come back less. A pain point is a hypothesis to test, not a test result.
Every map is a snapshot of the period it was drawn in. When prices, the carrier or the app version change, the stage signals change, and the old map no longer describes the new journey. Writing the map's date and data period at the top makes that risk visible.
A one-page customer journey map template
One page is enough for a first map, with the actor, the scenario and the data period at the top. Below them, the stages open as columns, and every stage gets the same fields. The table fills in those fields for the "track the order" stage of the hypothetical example.
Field: Customer's goal
- Hypothetical example: track the order
- Know where the order is
Field: What they do
- Hypothetical example: track the order
- Open the shipping notice, check the tracking page, open a ticket
Field: What they say
- Hypothetical example: track the order
- "My parcel has shown the same location for two days." (hypothetical quote)
Field: What they think and feel
- Hypothetical example: track the order
- Unsure, does not trust the delivery date
Field: Touchpoint and channel
- Hypothetical example: track the order
- Shipping notice (email), tracking page, support form
Field: Evidence
- Hypothetical example: track the order
- Interview notes, support tickets opened before delivery
Field: Problem
- Hypothetical example: track the order
- Delay or stale tracking data, not yet separated
Field: Owning team
- Hypothetical example: track the order
- Operations and carrier integration
Field: Success metric
- Hypothetical example: track the order
- Share of the cohort opening a ticket before delivery
| Field | Hypothetical example: track the order |
|---|---|
| Customer's goal | Know where the order is |
| What they do | Open the shipping notice, check the tracking page, open a ticket |
| What they say | "My parcel has shown the same location for two days." (hypothetical quote) |
| What they think and feel | Unsure, does not trust the delivery date |
| Touchpoint and channel | Shipping notice (email), tracking page, support form |
| Evidence | Interview notes, support tickets opened before delivery |
| Problem | Delay or stale tracking data, not yet separated |
| Owning team | Operations and carrier integration |
| Success metric | Share of the cohort opening a ticket before delivery |
For each pain point, the bottom of the page holds a one-sentence description, the owning team, the metric and the fix it connects to. Starting with three pain points leaves time to settle each one's owner and metric.
A customer journey map template filled in this way helps decide which problem needs a message flow and which needs a screen or process change. Where a message flow is needed, the library's flows are a starting point for a journey with a trigger, a wait and an exit condition.

What to read next
 November 14, 2026Email segmentation ideas: 10 examples with data and measurementTen email segmentation ideas, each with the data it needs, a concrete example and a way to measure its effect with a control group from the same segment.
 November 14, 2026How to increase customer lifetime value: choose a lever and measure itWhich of five levers raises customer lifetime value most depends on your starting numbers. Pick the lever from your data and measure it with a control group.
 November 12, 2026What is email automation? Flows, examples and toolsEmail automation sends an email when a person meets a rule you set once. How triggers, exits and re-entry work, with flow examples and what to check in a tool.